
Premium Report - ABC Inventory
ABC Inventory
Much like the Shopify ABC Inventory Analysis report, this report asigns a letter grade (A, B, or C) to each inventory item based on its sales performance.
For those of you who aren't familiar with Shopify's ABC grade for Inventory, the breakdown is as follows:
A-grade: These are your top-selling products, that collectively account for around 80% of your revenue (Gross Sales)
B-grade: These products collectively account for 15% of your revenue.
C-grade: These products collectively account for 5% of your revenue.
This report is useful to see which items contribute towards the bulk of your revenue so you can manage your inventory accordingly.
As a Premium Report, this is available on all Paid Plans of Report Toaster. If you aren't signed up, follow these steps to upgrade your account.
Please note - This report relies on Formula fields, which means that you will need to download the report to CSV and open in a program like Excel to see the results for ABC Grade (%) and ABC Grade
If you add any other columns to the report, be sure to only add them AFTER the two formula fields (or amend the formulas yourself in Excel).
Otherwise, the formulas will no longer be pointing at the correct columns and thus won't calculate correctly!
(click image to enlarge)
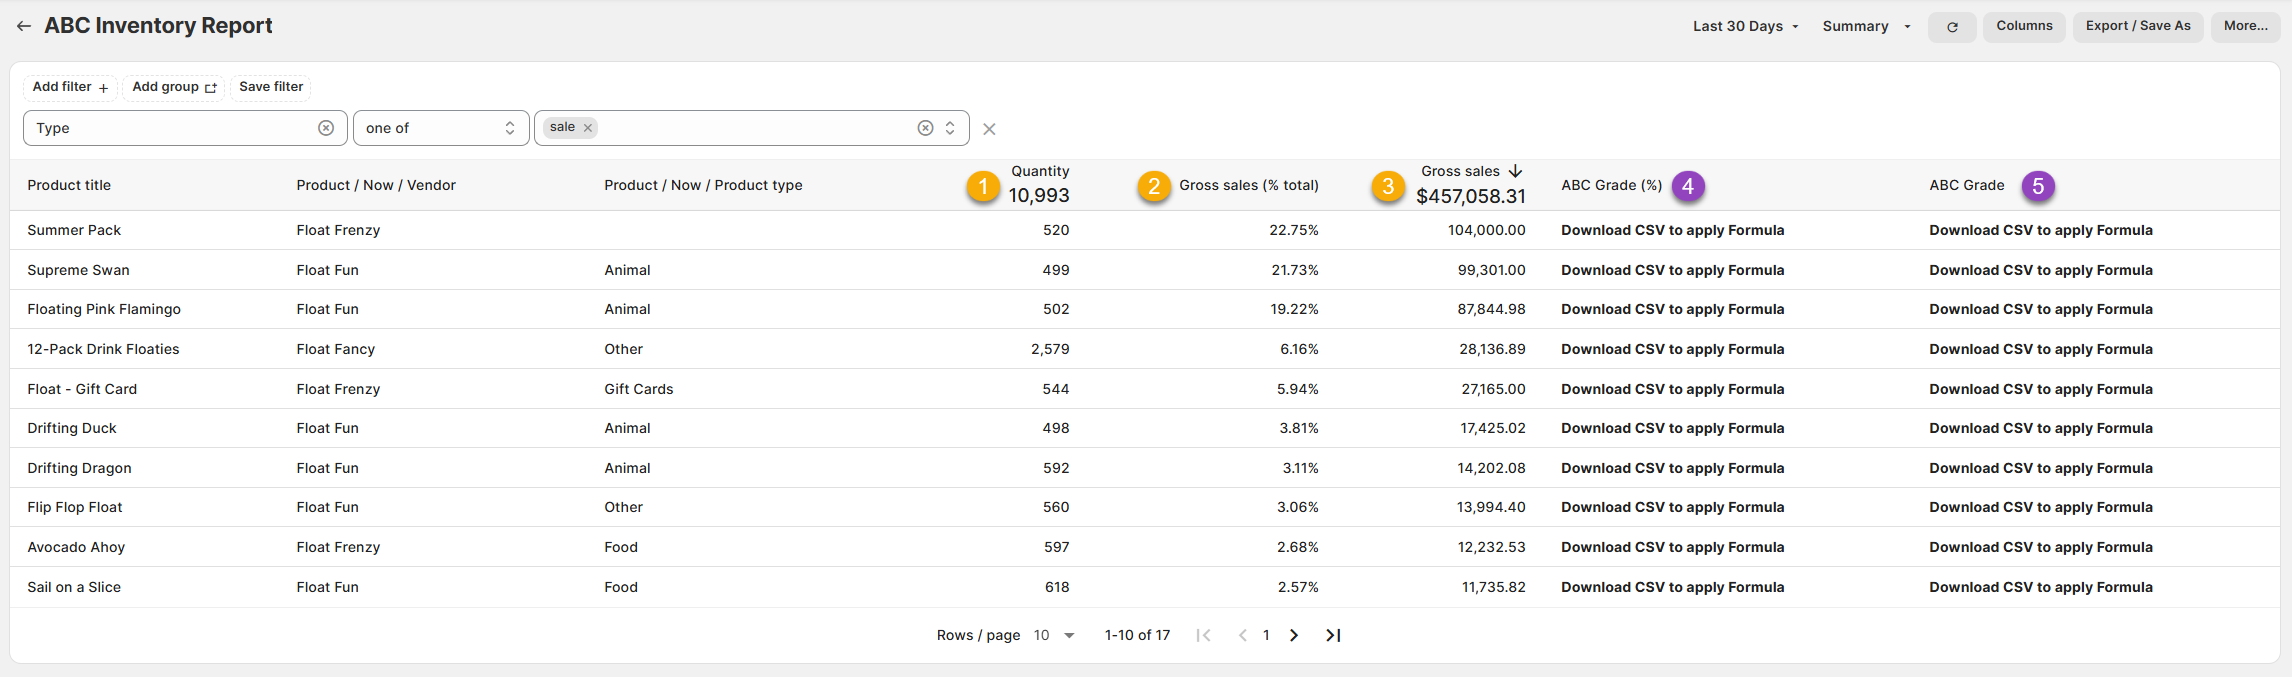
Here is what you need to be familiar with to understand the ABC Inventory report:
1.) Quantity: How many units were sold of the specific product.
For example, if I sold 498 Drifting Ducks in the last 30 days, then 498 would appear in the field.
2.) Gross Sales (% Total): What percentage of the total does the Gross Sales (below) of this item represent.
For example, if the Drifting Ducks made $17,425.02 in Gross Sales out of $456,058.31 that represents 3.81% of the total Gross Sales for the period.
3.) Gross Sales: The Price x Quantity of the units sold within that period.
For example, if I sold 498 Drifting Ducks in the last 30 days for 34.99 each, then $17,425.02 would appear in the field.
4.) ABC Grade (%): Formula Field - This formula turns Gross Sales (% Total) into a cumulative total so that the Grade (below) can be determined.
For example, the sum total of all the Gross Sales of these items will reach a cumulative total of 1 (100%)
5.) ABC Grade: Formula Field - The formula assigns an A, B, or C Grade (see intro) to this product based on how it contributes to your overall revenue.
For example, the Drifting Duck is one of the best-selling products over these last 30 days.
Collectively, it and the other best selling items make up the top 80% of our revenue, so it is given a grade of A.
Like all Report Toaster reports, these reports are fully customizable - so you can adjust the date range, add/remove columns, introduce a filter or change the sort to suit your individual needs. See our basic guides here for more info.
For other premium reports you can add to your account, check out our other article guides here.